

Businesses calculate the break even formula in unit sales volume or sales revenue to determine the sales revenue level required to cover their costs, which are split into fixed vs. variable costs. You can calculate the break-even point after assigning costs to fixed or variable categories for each product.
Breakeven analysis and its underlying contribution margin formula help businesses make decisions to improve performance.
What is a Break Even Point?
A break even point (BEP) is the point at which your total revenue is equal to your total costs, so your business has neither made nor lost money. Essentially, BEP tells you when your production costs are the same amount as your product revenue.
On a more in-depth level, break even point is the revenue level or per-unit sales level at which profit or loss is zero, but the fixed costs and variable costs are covered by the sales revenue generated. If non-cash expenses aren’t included in the calculation, a business can also compute its cash break even point.
How to Calculate the Break Even Point of Your Business
You can calculate the breakeven point of your business using fixed and variable costs or a computed contribution margin. Break even analysis calculates a break-even sales amount or a break even point (and contribution margin) on a unit sales volume basis for a product evaluation. The contribution margin is a profit margin on sales revenue after variable costs are incurred before fixed costs are considered.
The break-even analysis formula can be computed for a one-product small business or startup on a company basis using the total amount of sales and total expenses that are fixed costs or total variable costs.
A company or its business owner can calculate its total revenue, fixed costs, and variable costs through financial analysis. Then it can apply a break-even formula to determine at which point its net profit is zero, either as an amount of revenue or the number of units sold.
As a variation of the breakeven formula, you can calculate your cash break even point, which assesses break even cash flow instead of including non-cash expenses like depreciation in the calculation. Cash break even uses the same break even point formula.
Break Even Formula Quantity in Number of Unit Sales
The following formula calculates breakeven as the number of units that are sold.
Break Even Quantity in Unit Sales = Fixed Costs
Contribution Margin per Unit
where Contribution Margin per Unit = Sales Price per Unit – Variable Cost per Unit
Break Even Formula in Sales Revenue
The following formula calculates breakeven as sales dollars.
Break Even Sales Revenue = Fixed Costs
Contribution Margin Ratio
where Contribution Margin Ratio = Sales – Variable Costs
Sales
How to Understand Break-Even Analysis
To understand break-even analysis, divide fixed costs by the contribution margin ratio (sales per unit minus variable costs per unit sold). For business decision-making, it’s helpful to apply break-even analysis to each product under consideration and each product currently sold. The break-even formula determines the sales level (in units or sales revenue) required to cover costs before making a profit.
The sales per unit can be called the selling price per unit. A variable expense ratio is also known as the variable cost ratio. Examples of variable costs or expenses are raw materials, production supplies, and sales commissions that vary with production level or sales revenue produced by the sales force.
Fixed costs don’t change with volume. Examples of fixed costs are property taxes and G&A (general & administrative) expenses, including office rent.
Examples of Break-Even Analysis
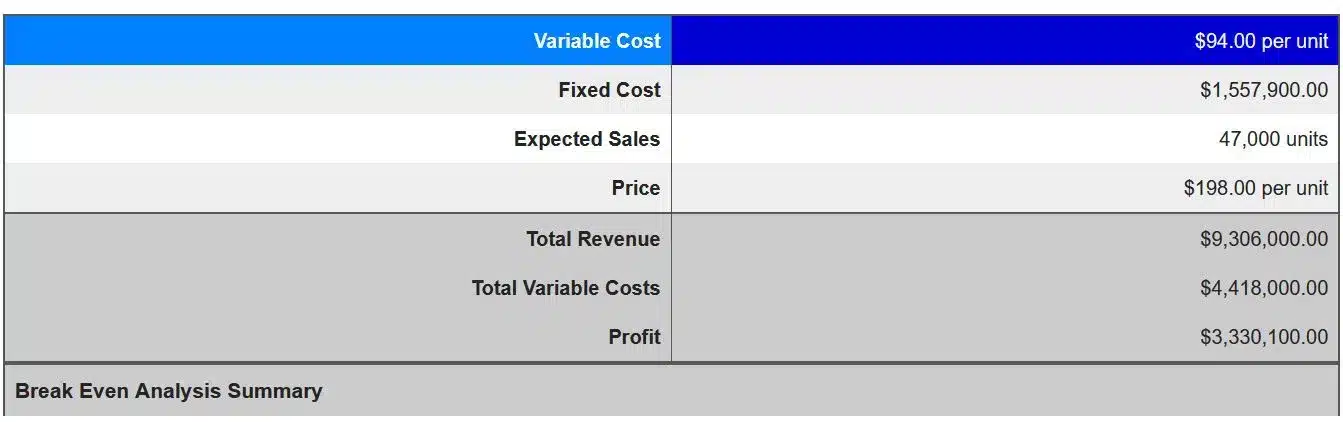
Assumptions for examples of break-even analysis calculations are shown in the table below for Solidtude’s Product A.
Assumptions for Company Solidtude’s Breakeven Analysis – Product A
| Sales Revenue | $9,306,000 | 100% of Sales |
| Variable Costs | $4,418,000 | 47.47475% of Sales |
| Contribution Margin | $4,888,000 | 52.52525% of Sales |
| Fixed Costs | $1,557,900 | |
| Unit Sales | 47,000 | |
| Selling Price per Unit | $ 198 | |
| Variable Costs per Unit | $ 94 |
Break Even Analysis in Number of Unit Sales
Break Even Quantity in Unit Sales = Fixed Costs
Contribution Margin per Unit
where Contribution Margin per Unit = Selling Price per Unit – Variable Cost per Unit
Break Even Quantity in Unit Sales = $1,557,900
($198 – $94)
Break Even Quantity in Unit Sales = $1,557,900
($104)
Break Even Quantity in Unit Sales = 14,980 units
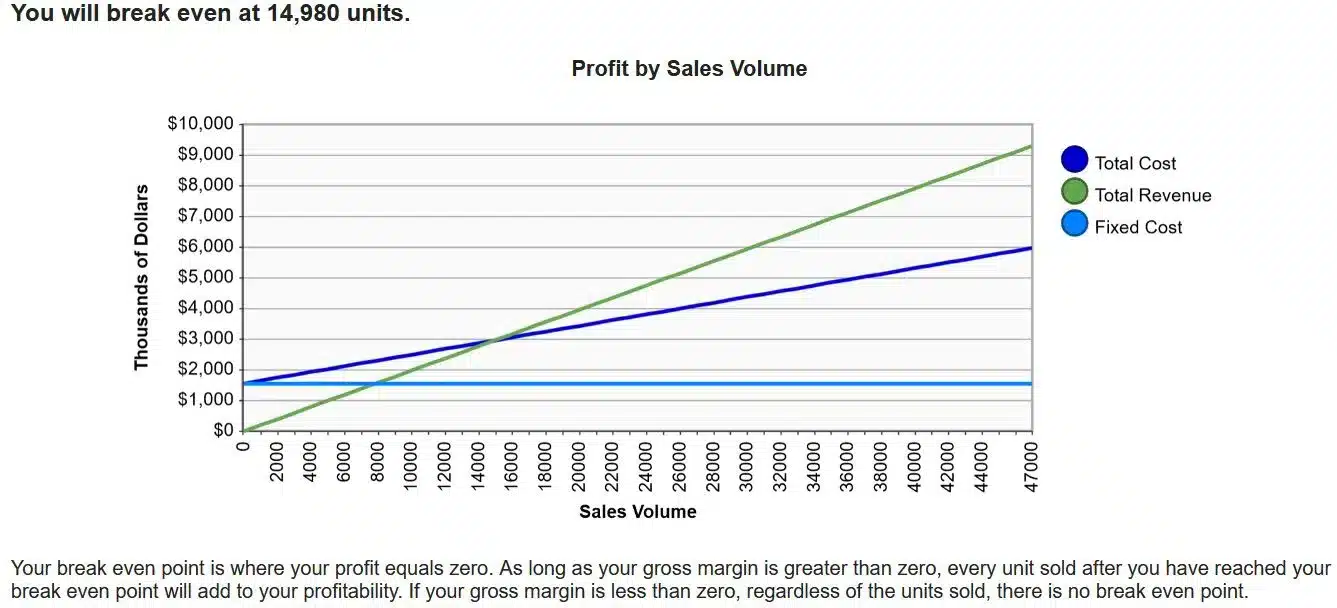


Source of Images: National Association for the Self-Employed – NASE Breakeven Analysis Calculator
Break Even Analysis as Sales Dollars Calculation
Break Even Sales Revenue = Fixed Costs
Contribution Margin Ratio
where Contribution Margin Ratio = Sales – Variable Costs
Sales
Break Even Sales Revenue = $1,557,900
($9,306,000 – $4,418,000)/$9,306,000 = 52.52525%
Break Even Sales Revenue = $1,557,900
0.5252525
Break Even Sales Revenue = $2,966,002
Proof: 14,980 break even units x $198 selling price per unit = $2,966,040 sales revenue
(with slight rounding difference compared to calculation)
Although break even is easy to compute with a formula once you’ve determined fixed and variable costs by product, you can use an online break even calculator.
Breakeven calculator choices include the National Association for the Self-Employed’s NASE breakeven calculator, the U.S. Small Business Administration’s SBA break even calculator online, or another that you like. If you decide to use the NASE calculator, round the forecast unit sales number to the nearest thousand (for example, enter 47,000).
Biggest Factors That Could Change Your Break Even Point
By implementing business growth and cost reduction strategies, management can change the break even point for your business calculated by financial analysts. The break even point can also change in response to external factors like inflation resulting in product cost increases, a recession, and increased competition. You have less control over the external factors.
Sales increases or decreases
Sales can either increase or decrease through pricing changes and changes in the volume of units sold. When sales increase through volume changes, more units are sold, reducing the variable cost per unit and increasing the contribution margin ratio. Selling price increases per unit have the same effect of increasing the contribution margin per unit sold. As more or fewer units are sold, fixed costs allocated to each product can change.
Cutting costs and expenses
To improve business performance or if fixed costs are too high, the break even point can be lowered by cutting production costs and business expenses.
Manufacturing businesses can reduce production costs by improving quality, thereby reducing material scrap and product rework. If their ERP system integrates with intelligent shop floor hardware and software, including IoT sensors, AI monitoring, and early problem alert notifications, variable product costs can also be cut.
Buying new equipment
When a manufacturing business buys new production equipment, it replaces variable labor costs with a fixed cost. This can result in a change to the breakeven point. As production volume increases, the benefit of the new equipment will increase.
Adding or eliminating product lines
Because breakeven analysis is often computed on a product line basis, adding new products or eliminating unprofitable product lines will change your company’s overall breakeven point. The fixed overhead allocated to each product will be different after a change in product offerings. And variable costs will be added for new products or eliminated when a product is cut.
Importance of the Break Even Point Formula
The break even point formula is important because it lets a company plan, price, and manage its profitability and cash flow by setting pricing and revenue goals, increasing sales efforts, selecting new products from new business ideas, and cutting costs.
Using contribution margin by product in that breakeven calculation, the business can determine its pricing strategy create price quotes, calculate acceptable volume discounts, and decide whether to accept new sales orders at pricing below standard list price. The company can also assess whether proposed new products should be added to its product line or if unprofitable existing products should be discontinued.
In connection with the break even point formula, a company can determine its margin of safety. Margin of safety is the level by which sales units or revenue can fall before reaching the break-even point. Monitoring margin of safety increases the probability of business success when appropriate actions are taken to keep the sales level above the break even point.