The world’s most efficient company earns more than $2 million in profit for every employee on its payroll.
Tipalti analyzed the Fortune Global 500 to identify which organizations generate the most profit per worker, drawing on publicly reported net profit and employee numbers. We also reviewed industry-level AI investment data to provide context on how innovation could be shaping global productivity.
Explore the full data approach and calculation process in our methodology.
Efficiency at this scale often comes down to operational design. Like, how companies manage approvals, reporting, and mass payments without adding headcount.
Learn more about how accounts payable automation and AI in finance can help your business increase its profit per employee today.
Key Findings
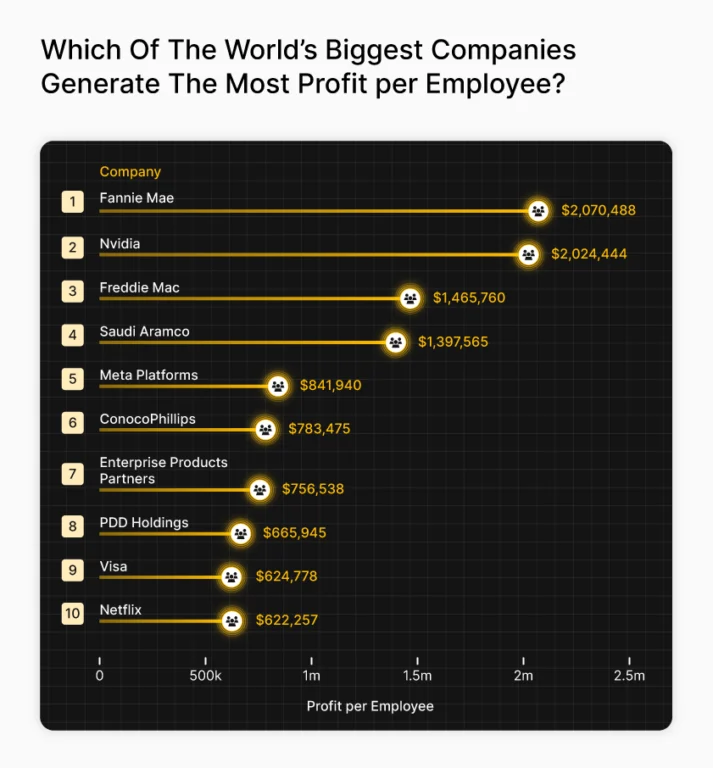
- Financial service Fannie Mae tops the global list with $2.07 million in profit per employee, followed by Nvidia at $2.02 million.
- The average Fortune Global 500 company generates around $77,000 worth of profit per employee, meaning top performers are achieving over 25 times that figure.
- Media, social, and marketing businesses recorded the highest overall profitability per worker at $22,167.
- At the other end, Pemex and Warner Bros. Discovery reported the steepest losses per employee, at over $300,000.
Which Of The World’s Biggest Companies Generate The Most Profit per Employee?
These top performers demonstrate what’s possible when operational design, automation, and technology align. The chart below reveals which Fortune Global 500 companies earn the most profit per employee—and how wide the efficiency gap has become.
The most efficient companies in the world earn millions in profit per worker—far exceeding the global average. So, which companies are setting the new standard for efficiency, and how does technology fit into the equation?
| Rank | Company | Profit ($M) | Employees | Profit per Employee |
|---|---|---|---|---|
| 1 | Fannie Mae | $16,978 | 8,200 | $2,070,488 |
| 2 | Nvidia | $72,880 | 36,000 | $2,024,444 |
| 3 | Freddie Mac | $11,858 | 8,090 | $1,465,760 |
| 4 | Saudi Aramco | $104,982 | 75,118 | $1,397,565 |
| 5 | Meta Platforms | $62,360 | 74,067 | $841,940 |
| 6 | ConocoPhillips | $9,245 | 11,800 | $783,475 |
| 7 | Enterprise Products Partners | $5,901 | 7,800 | $756,538 |
| 8 | PDD Holdings | $15,626 | 23,465 | $665,945 |
| 9 | Visa | $19,743 | 31,600 | $624,778 |
| 10 | Netflix | $8,712 | 14,000 | $622,257 |
1. Fannie Mae | Almost $2.1 Million per Employee
Fannie Mae’s profits of nearly $17 billion across 8,200 employees translate into more than $2 million per worker, the highest profit per employee in the Fortune Global 500.
In Q2 2025, Fannie Mae reported a net worth of $101.6 billion, and total non-interest expenses were $2.3 billion, down from $2.4 billion in the same quarter a year earlier, which could be due to a modest reduction in operating costs.1
2. Nvidia | Over $2.0 Million per Employee
In 2025, Nvidia reported $130.5 billion in revenue and $72.88 billion in net income. Revenue increased 114% year over year, while net income rose 145%.2 And these profits expanded far faster than its workforce. Headcount increased to about 36,000 employees in 2025, up nearly 22% from 2024.3
The company’s filings indicate that gross margin growth was primarily driven by its Data Center segment, which increased by 142% from the previous year.2 The rise was led by demand for Hopper GPU architecture used in generative AI and large-language-model training.
3. Freddie Mac | Nearly $1.5 Million per Employee
Freddie Mac reported $11.9 billion in net income for 2024, with a workforce of approximately 8,000 employees, resulting in the third-highest profit-per-employee figures globally.
Like Fannie Mae, its model uses automation and data. Once the infrastructure is established, each additional loan generates revenue far faster than it incurs costs.
The company has continued to expand automation across its operations to improve efficiency for both employees and customers. One example of this is bringing improvements to their Loan Product Advisor, an automated underwriting system.4
Small Teams, Big Returns
Big profits don’t always require big teams. Across the Fortune Global 500, a handful of smaller companies prove that efficiency can outweigh scale, with each employing 4,500 people or fewer yet generating millions in profit.
| Rank | Company | Profit ($M) | Employees | Profit per Employee |
|---|---|---|---|---|
| 1 | St. James’s Place | $509 | 3,334 | $152,669 |
| 2 | Hangzhou Industrial Investment Group | $371 | 4,010 | $92,618 |
| 3 | StoneX Group | $261 | 4,500 | $57,956 |
| 4 | GS Caltex | $80 | 3,201 | $24,961 |
| 5 | Plains GP Holdings | $103 | 4,200 | $24,524 |
While their total profits are modest compared with global giants, these companies’ profit per employee rivals or exceeds much larger competitors.
St. James’s Place, for instance, generates over $150,000 per worker, higher than many multinational corporations with ten times as many employees. GS Caltex, with just over 3,200 employees, recorded $80 million in profit, equal to nearly $25,000 per person.
Which Industries Generate The Most Profit Per Employee?
Industry structure plays a big role in workforce efficiency. Businesses operating in data-driven or asset-light sectors often can operate with smaller workforces, while labor-intensive industries face tighter margins and slower gains in profit per employee.
| Rank | Industry | Profit ($M) | Employees | Profit per Employee |
|---|---|---|---|---|
| 1 | Media, social platforms, marketing | $217,148 | 979,585 | $22,167.38 |
| 2 | Construction and air conditioning | $10,821 | 78,421 | $13,798.85 |
| 3 | Robots, sensors, and IT hardware | $308,761 | 2,800,710 | $11,024.40 |
| 4 | Healthcare, drugs, and biotechnology | $122,553 | 1,708,941 | $7,171.28 |
| 5 | Financial and insurance services | $966,125 | 14,056,416 | $6,873.20 |
| 6 | Consumer products | $47,314 | 923,520 | $5,123.26 |
| 7 | IT infrastructure and hosting | $190,873 | 4,041,513 | $4,722.81 |
| 8 | Energy, raw materials, and utilities | $406,573 | 9,661,134 | $4,208.34 |
| 9 | Food and beverages | $62,339 | 2,289,364 | $2,722.99 |
| 10 | Business processes and support services | $280,458 | 10,591,258 | $2,648.01 |
The most efficient companies are not in manufacturing or finance but in media and marketing, where companies average more than $22,000 in profit per employee.
Digital business models—driven by advertising, scalable platforms, and automation—allow these firms to increase returns without proportional increases in staff.
The construction and air-conditioning sector ranks second at nearly $14,000 per employee. Despite being labor-intensive, the industry benefits from post-pandemic demand and advances in design and materials technology that continue to improve productivity.
Is AI the New Driver of Workforce Efficiency?
Venture capital funding in artificial intelligence now runs into the hundreds of millions, but the data shows that spending alone doesn’t always deliver immediate efficiency gains. But where is it making the difference?
| Industry | AI Investment Ranking | Profit Ranking | Profit per Employee | VC Investments in AI per Employee |
|---|---|---|---|---|
| Media, social platforms, marketing | 1 | 1 | $22,167 | $28,734 |
| IT infrastructure and hosting | 2 | 7 | $4,723 | $13,891 |
| Healthcare, drugs and biotechnology | 3 | 4 | $7,171 | $6,785 |
| Construction and air conditioning | 4 | 2 | $13,799 | $4,371 |
| Robots, sensors, and IT hardware | 5 | 3 | $11,024.40 | $3,349 |
Industries investing most heavily in artificial intelligence are beginning to see stronger returns on efficiency. Media, social, and marketing companies lead both AI investment and profitability, generating around $22,000 per worker while receiving more than $28,000 in AI funding per employee.
Other sectors show slightly slower progress. IT infrastructure and hosting ranks second for AI investment but only seventh for profit per employee, reflecting the high upfront cost of large-scale AI deployment.
In healthcare and biotechnology, significant AI investment supports innovation in diagnostics and drug development, but long testing cycles and regulatory requirements delay short-term efficiency gains.
Methodology
The analysis is for informational purposes only and does not constitute investment advice, recommendations, or solicitation to buy or sell securities. Past performance does not predict future results.
As efficiency becomes the defining measure of business success, we wanted to understand which of the world’s largest companies is achieving the most profit from every employee and what this says about productivity, automation, and the future of work.
To find out, we collected the following data from the latest version of the Fortune Global 500:
- Net profit
- Number of employees
We then calculated the profit per employee by dividing the net profit by the number of employees.
Next, we took the VC investments in AI by industry from OECD. Like with profit, we then calculated the investment per employee.
All data was collected in October 2025 and is correct as of then.
Sources
- Fannie Mae
- Securities and Exchange Commission
- Macrotrends
- Freddie Mac
- Reuters
- Warner Bros. Discovery
- Bristol-Myers Squibb
Tipalti is the AI-powered platform for finance automation, elevating how finance teams operate in the global economy. We empower our customers to scale faster and smarter by removing the complexities of doing global business and accelerating their finance operations efficiency. Our platform provides a comprehensive suite of finance automation solutions designed for mid-market businesses, across accounts payable, global payouts, procurement, employee expenses, corporate cards, supplier management, tax compliance, and treasury. Tipalti partners with leading financial institutions such as Citi, Wells Fargo, J.P. Morgan and Visa, enabling over 5,000 global companies to efficiently and securely pay millions of suppliers and payees across 200+ countries and territories, in 120 currencies. For more information, visit tipalti.com.