

The banking crisis of 2008 created opportunities for innovation in the banking world. This is where financial technology, better known as fintech, saw its rise to prominence. After the 2008 banking crisis, fintech saw its financial investment levels increase twelvefold by 2014, offering a more personalized service that puts people back in control of their finances.
Put in simple terms, Fintech refers to new technology that enhances and automates financial services for consumers and businesses. Some examples are Monzo, Venmo and Cashapp, which offer mobile banking and peer-to-peer payment services. This technology can be used to make automated payments and give you instant digital access to your finances.
Our financial technology experts at Tipalti have researched which countries have embraced fintech the most. We’ve looked at global fintech adoption rates, Google searches for fintech by country, and the regions that have the highest virtual capital funding, to uncover the world’s biggest Fintech adoption hotspots.
Countries with the highest rate of fintech adoption
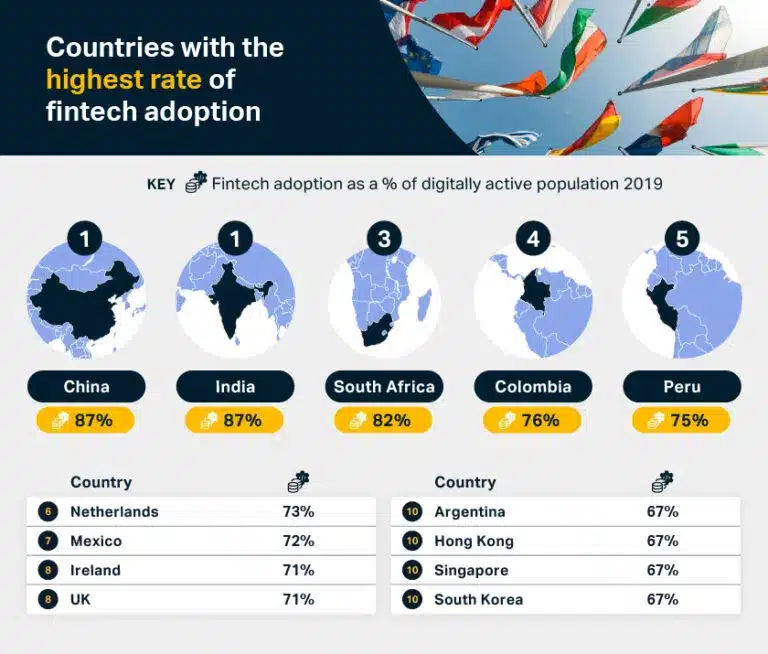
1. China
FinTech Adoption as a % of Digitally Active Population 2019: 87%
China and India, leading the fintech market for years, have emerged as the countries with the highest fintech adoption rate. As of 2019, 87% of China’s digitally active population has adopted the use of fintech.
2. India
FinTech Adoption as a % of Digitally Active Population 2019: 87%
India, tied with China at an 87% adoption rate, is leading the way for the adoption of fintech. Between 2021 and 2022, India had around 6,600 fintech startups with a total market value of 31 billion US dollars, making India the third largest fintech ecosystem in the world. Though, in the first half of 2023, the investment into fintech startups in India dropped by 67%. Despite this massive dip in investment, it is still the third-highest funded country for fintech in the world as of 2023, trailing only the United States and the UK.
3. South Africa
FinTech Adoption as a % of Digitally Active Population 2019: 82%
South Africa has the third-highest adoption rate of fintech, with 82% of the digitally active population now using it. South Africa is internationally recognized as a small fintech market that is highly sophisticated and fast-growing, making up 40% of all fintech revenue in Africa.
4. Colombia
FinTech Adoption as a % of Digitally Active Population 2019: 76%
Colombia has the fourth-highest adoption rate for fintech usage, with 76% of its digitally active population using fintech services as of 2019. Colombia also had the highest adoption rate in Latin America, beating Chile and Brazil.
Comparison of fintech adoption in six markets
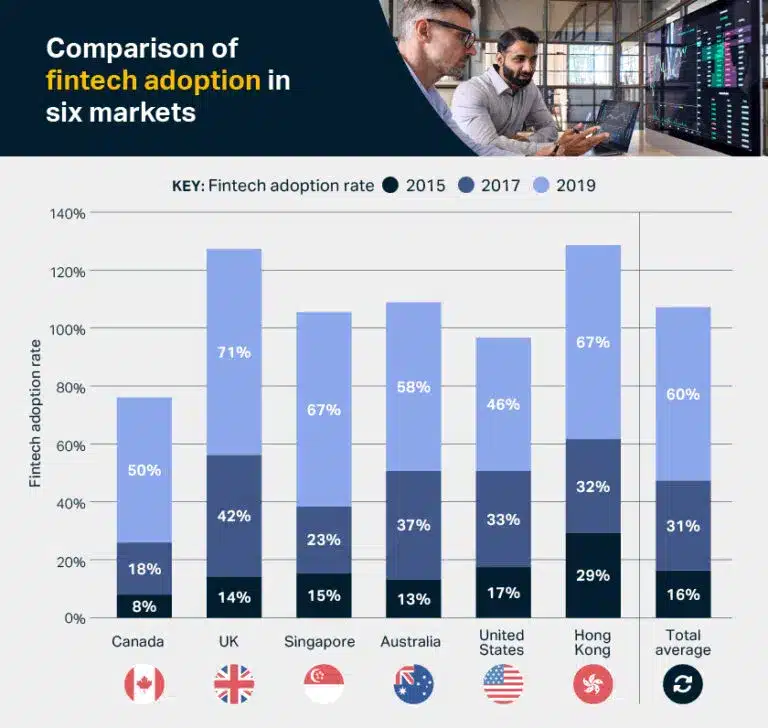
Across the six markets that were researched, there are just three that are above the 60% average for fintech adoption rates as of 2019: the UK, Singapore and Hong Kong. In fact, despite having one of the largest fintech economies in the world, the US has just a 46% fintech adoption rate, the lowest of the six markets.
In terms of the growth of fintech adoption rates from 2015 to 2019, Canada leads the way. The adoption rate in 2015 was just 8%, which increased to 50% in 2019, and the average growth rate was 151.39% from 2015 to 2019.
Following Canada, the UK and Singapore had the next highest adoption growth rates, at 134.52% and 122.32%, respectively. The market with the lowest growth rate for fintech adoption was Hong Kong, at an average of just 59.65% from 2015 to 2019, below the total average of 93.65%.
Regions with the highest venture capital funding
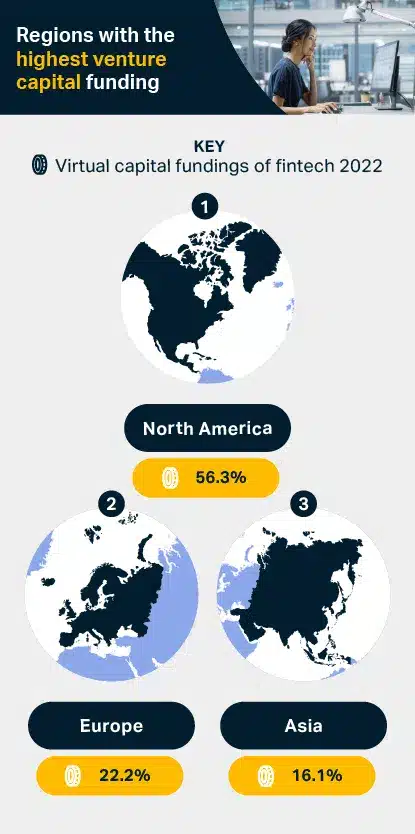
1. North America
Virtual Capital Fundings of FinTech 2022: 56.3%
North America is the region with the highest amount of venture capital funding into its fintech industry as of 2022. Of the global capital funding that has gone into fintech in 2022, 56.3% has gone specifically to the North American fintech market.
2. Europe
Virtual Capital Fundings of FinTech 2022: 22.2%
Receiving the second highest proportion of venture capital funding in fintech is Europe, which is home to some of the most well-known disruptor banks in fintech, such as Revolut, Monzo and Starling Bank. Of the venture capital funding into fintech in 2022, 22.2% went into European markets.
3. Asia
Virtual Capital Fundings of FinTech 2022: 16.1%
Alongside the US, China has one of the biggest fintech markets in the world, and many other Asian countries have high fintech adoption rates. Asia has the third largest venture capital funding as of 2022, with 16.1% of all venture capital funding for fintech going to the continent.
Countries with the most Google searches for “fintech”
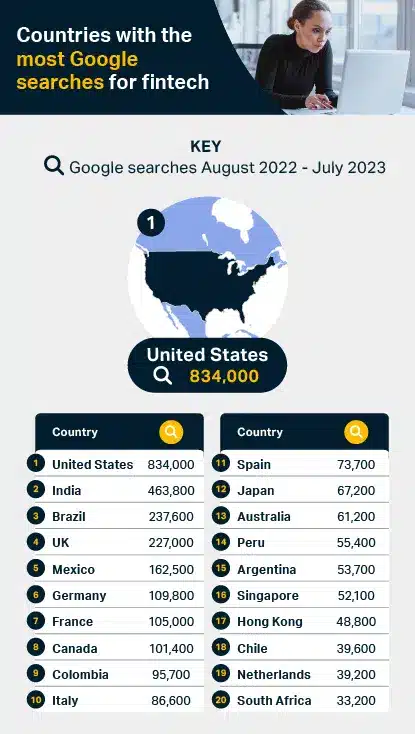
1. United States
Google Searches August 2022 – July 2023: 834,000
The US comes out as the country with the most searches for fintech, indicating a particular interest in the services the industry can provide. From August 2022 to July 2023, there have been 834,000 Google searches for fintech in the US.
2. India
Google Searches August 2022 – July 2023: 463,800
India, which had one of the highest fintech adoption rates in the world in 2019, has the second most searches for fintech in the last 12 months. In India, from August 2022 to July 2023, there were 463,800 Google searches for the term fintech.
3. Brazil
Google Searches August 2022 – July 2023: 237,600
Rounding out the top three countries with the most searches for fintech, we have Brazil, which has had around 237,600 Google searches in the last 12 months. This level of interest is perhaps unsurprising when we consider that Brazil, with an estimated 1,289 fintech start-up companies, has the biggest fintech market in Latin America.
How Fintech adoption rates have changed over time
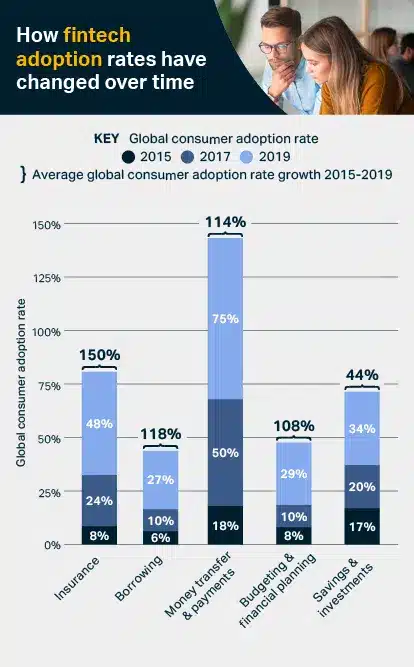
Fintech adoption rates increased dramatically from 2015 to 2019 and the finance sector continues it’s digital transformation. In fact, in 2021, 86% of consumers in the UK used fintech to manage their finances, and around 48% of people in the US used fintech in 2022.
Of the subsectors in fintech, insurance, also referred to as insurtech, has seen the biggest growth in adoption from 2015 to 2019. The global adoption rate for insurtech was just 8% in 2015; by 2019, it had grown to 48%. During that same period, insurtech averaged a 150% adoption growth rate.
Borrowing in the fintech sector has also seen a massive increase in adoption rates, averaging a 118% growth rate between 2015 and 2019. Fintech borrowing has certain advantages over traditional bank borrowing, as it does not rely solely on your credit score, and the processing time is generally quicker and more streamlined.
Countries with low fintech adoption and key blockers
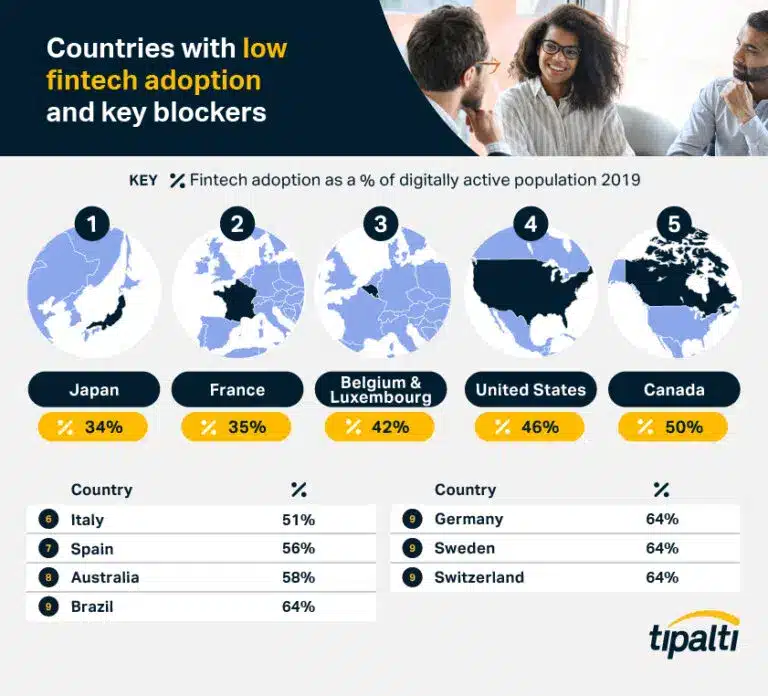
1. Japan
FinTech Adoption as a % of Digitally Active Population 2019: 34%
Japan had the lowest adoption rate of fintech amongst the country’s digitally active population, at just 34% as of 2019. This sees Japan lagging behind other countries in Asia, such as China and Singapore. However, this is largely due to the innate nature of Japan’s financial environment, which is extremely conservative and risk-averse. As a result, fintech investment is low in the country.
2. France
FinTech Adoption as a % of Digitally Active Population 2019: 35%
France, with an adoption rate of 35% for fintech in 2019, had the second lowest rate of adoption. Despite the country’s close proximity to the UK, which is home to some of the world’s biggest fintech challenger banks such as Monzo, France is far behind other European countries such as the UK and the Netherlands. This lower rate of adoption has been attributed to a simple lack of awareness amongst consumers in the country.
3. Belgium & Luxembourg
FinTech Adoption as a % of Digitally Active Population 2019: 42%
Belgium takes the third spot for countries with the lowest fintech rate of adoption, having just 42% as of 2019. As with France, the main reason that fintech adoption is lower in these regions is due to a lack of awareness, especially when it comes to the services that fintech offers.
Methodology –
We used EY’s Global FinTech Adoption Index to get the adoption rates for 27 countries from figure 1. We then used figure 2 for the comparison of fintech adoption rates from 2015 to 2019 from six different countries, which we then used to calculate the average year-on-year growth in fintech adoption for these countries.
Using Demand Sage’s ‘Fintech Startups Statistics’, we were able to get the percentage of the overall virtual capital funding in fintech for different regions in the world.
We used Google Keyword Planner to get the search volume for the term ‘fintech’ for each country between August 2022 and July 2023.
And lastly, we used Statista’s ‘Consumer fintech adoption rates globally from 2015 to 2019, by category’ to analyze how fintech adoption rates have changed over time.