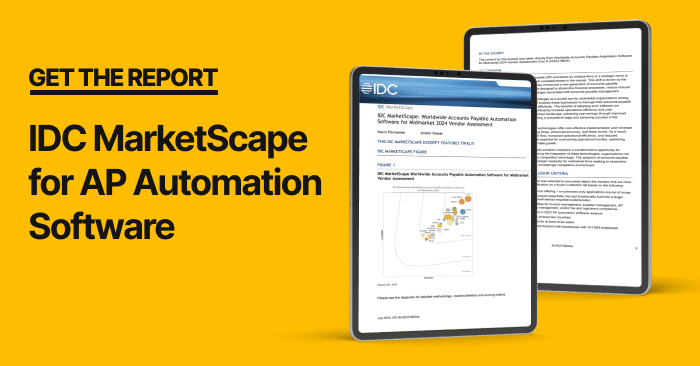
Read IDC’s MarketScape Report for Top Global AP Automation Solutions.
Fill out the form to get your free eBook.

For a second time, Tipalti has been named a Leader in the IDC MarketScape: Worldwide Accounts Payable Automation Software for Midmarket 2024 Vendor Assessment. This recognition highlights our ability to automate, derisk, and scale payables workflows while keeping finance teams informed. Analysts noted PO matching capabilities and effective invoice collaboration as standout strengths at Tipalti.
IDC MarketScape vendor analysis model is designed to provide an overview of the competitive fitness of technology and suppliers in a given market. The research methodology utilizes a rigorous scoring methodology based on both qualitative and quantitative criteria that results in a single graphical illustration of each supplier’s position within a given market. The Capabilities score measures supplier product, go-to-market and business execution in the short-term. The Strategy score measures alignment of supplier strategies with customer requirements in a 3-5-year timeframe. Supplier market share is represented by the size of the icons.
IDC Copyright
IDC MarketScape: Worldwide Accounts Payable Automation Software for Midmarket 2024 Vendor Assessment (Doc # US52378624), July 2024, Kevin Permenter and Jordan Steele
Does your business track the ratios it needs to improve financial visibility, operational efficiency, and profitability?
The return on sales ratio helps companies focus on operational efficiency and the degree to which operating profits flow from sales and service revenues. But when do you use it, and how do you calculate ROS?
Improving return on sales requires a strategic finance focus to improve business results. Levers include analyzing potential new revenue streams and cutting operational costs through decision-support analysis, negotiation with suppliers, and scalable automation systems for the digital transformation of your growing business.
What is Return on Sales (ROS)?
Return on sales (ROS) is a financial ratio assessing the percentage of business operating profit earned from net sales or net revenue. The return on sales formula uses EBIT (earnings before interest and taxes) in the numerator for operating profit. The return on sales ratio measures operational efficiency and profitability.
How to Calculate Return on Sales
The formula to calculate return on sales (ROS) is:
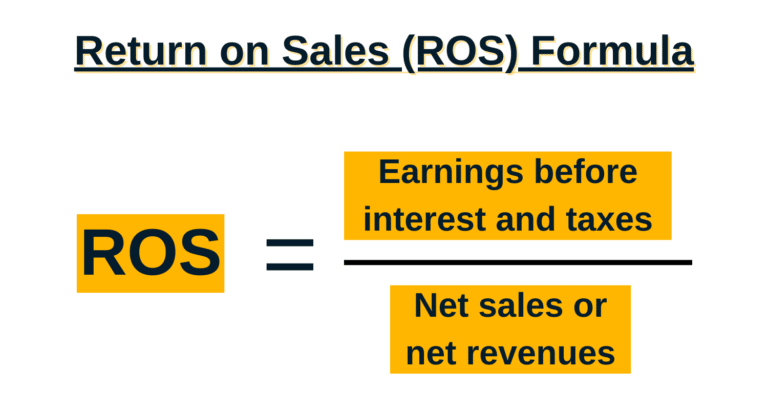
When you calculate return on sales, use the net sales revenue or total net revenues on the income statement included in the financial statements. If the company reports net revenues, which consists of the sales of goods and the sales of services, use the amount of net revenues in the return on sales calculation. Your goal is to capture net total sales from all business operations. Net sales or net revenues means after returns & allowances and sales discounts.
Earnings before Interest and Taxes (EBIT) is the operating profit margin, also known as operating income. Taxes means income taxes. Operating profit is net revenues minus cost of goods sold and cost of services to equal gross profit margin, less operating expenses. Note that non-operating activities are excluded from the ROS ratio analysis.
Your company can calculate return on sales monthly after closing the books and graph trends.
What Does Return on Sales Show You?
Return on sales is a profitability ratio and efficiency ratio. ROS shows the percentage of profits generated from each net dollar of sales (or net revenues). The higher the return on sales, the more profitable the business. For calculating return on sales, use earnings before interest and taxes (EBIT) from operating businesses.
Company goals should include increasing the return on sales metric, revenues, and operating profit. Increasing ROS shows business profitability improvement. Decreasing ROS means that the company’s profitability is eroding, either due to a lower sales level or increased operational costs and expenses.
The actual cash generated from these EBIT earnings will have reinvestment potential, although it’s not measured by the ROS ratio.
How can you improve business results with strategic finance?
Download our Research Report: “CFOs Drive Business Value: How Strategic Leaders Transform Financial Operations” to learn how CFOs think strategically to drive operating results.
Use best practices to gain operational efficiency and cut costs by implementing a digital transformation strategy that AP automation software provides.
What Is a Good Return on Sales?
A good return on sales is 5 to 20 percent, depending on industry statistics. That means your company is producing favorable operating profitability of at least 5 to 20% on its net revenues. Some industries have a higher cost structure than other industries.
When comparing the return on sales for your business, compare it to other companies in the same industry. Track trends for return on sales over time. Determine if increasing ROS results from the business enhancement actions you’re taking.
For return on sales comparisons, your company can:
- Use SEC EDGAR company filings for competitors
- Buy industry statistics
To get industry statistics, consider RMA Statement Studies from the Risk Management Association or another source like Dun & Bradstreet, which offers Industry Norms and Key Business Ratios by industry SIC code. ReadyRatios provides return on sales ratios (that it also calls operating margin) for publicly-traded companies by industry using information compiled from SEC reports. Not all of the ReadyRatios industries are specific enough for comparison. For example, Medical device manufacturing isn’t separately listed as an industry.
Real-Life Examples of Using the ROS Formula
Medical device maker, Medtronic plc, filed a Form 10-K annual report with the SEC on June 23, 2022, for its fiscal year ended April 29, 2022. The 10-K includes Consolidated Statements of Income for the fiscal years ended 2022, 2021, and 2020, as shown in the screenshot below.
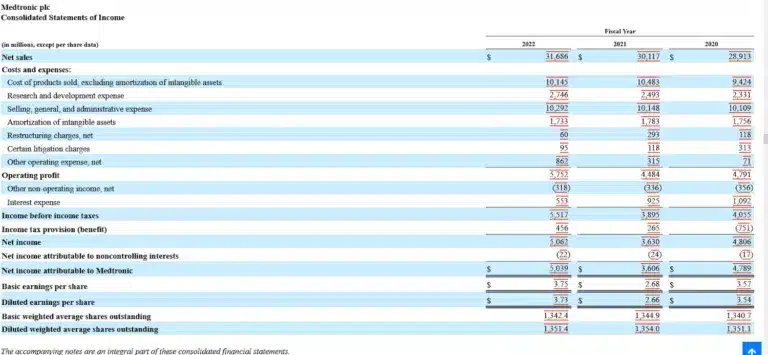
For the year 2022, Medtronic reported (in millions of dollars), Net sales of $31,686 and Operating profit of $5,752. Medtronic’s operating profit is equivalent to Earnings before Interest and Taxes (EBIT).
Compute Medtronic’s return on sales for the fiscal year ended April 29, 2022, as follows:
Medtronic ROS = EBIT / Net sales or Net revenue
ROS = $ 5,752 / $31,686
Medtronic Return on Sales (ROS) = 18.2%
Comparing Medtronic’s ROS to Intuitive Surgical’s Return on Sales
As a point of comparison, Intuitive Surgical, Inc. is a robotic surgical medical device maker. Medtronic and Johnson & Johnson compete in the robotic surgical equipment market, although Intuitive Surgical has the edge due to high switching costs, according to MedTech Dive. Both Medtronic and Johnson & Johnson compete in many other medically-related markets.
Intuitive Surgical filed a Form 10-K annual report with the SEC on February 3, 2022, for its year ended December 31, 2021. The 10-K includes Consolidated Statements of Income for the calendar years ended December 31, 2022, 2021, and 2020, as shown in the screenshot below.
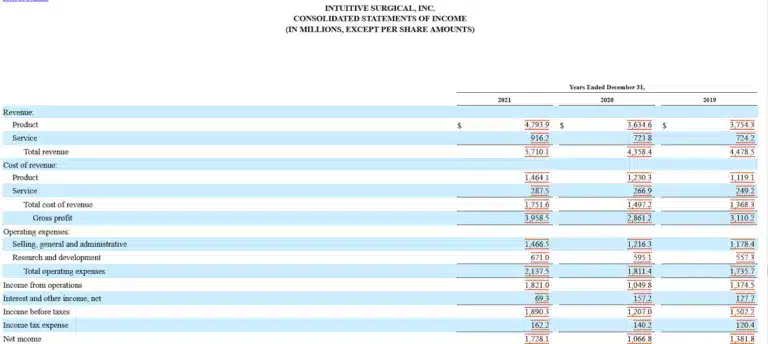

Intuitive Surgical Shows two lines for revenue: one for products and one for services on its income statement for the year ended December 31, 2022. Total revenue (in millions of dollars) is $5,710.1 Income from operations (equal to EBIT) is $1,821.0.
To calculate return on sales, use Total revenue (from products and services), which is net revenue, according to GAAP requirements. (Don’t just use the net sales line from product revenue.)
Intuitive Surgical ROS = EBIT / Net sales or Net revenue
ROS = $ 1,821.0 / $ 5,710.1
Intuitive Surgical Return on Sales (ROS) = 31.9%
Although it would be better to compare a company to total industry statistics or more close competitors, the return on sales for both Medtronic and Intuitive Surgical show that the medical device industry can be highly profitable after the FDA approves their products for sale. Both companies must be doing something right to generate these high operating profits from net revenues.
Perks of Using the ROS Formula
Perks of using the ROS (return on sales) formula are:
- The ROS ratio provides financial visibility as feedback on business efficiency in converting revenue to profits.
- Companies can analyze their ROS trends over time and benchmark ROS with with different companies, such as top competitors, industry average, and best in industry.
- The ROS formula, which uses EBIT or operating profit compared to net revenues, can be used as a guide to increase operational efficiency, revenues, and profitability.
- Investors and other stakeholders can use the ROS formula to determine if the company is profitable enough to continue paying dividends and repay debt obligations.
Pitfalls of Using the ROS Formula
Pitfalls of using the ROS (return on sales) formula are:
- Your company’s ROS can only be compared to companies in the same industry because ROS ratios, costs, margins, and profitability vary widely by industry.
- The ROS ratio is very high level, without added granularity to know where to make changes to the business model and increase operational efficiency.
- The ROS formula is based on accrual accounting and doesn’t measure the efficiency of cash use, working capital conversion to cash during the operating cycle, or asset turnover, as do other efficiency ratios.
- The ROS formula doesn’t consider interest expense incurred because it uses EBIT, which is earnings before interest and taxes.
Note that the return on sales formula uses EBIT (earnings before interest and taxes) in the numerator that isn’t equal to cash. Even if you use EBITDA (earnings before interest, taxes, depreciation, and amortization) in a modified ROS formula, it won’t be equivalent to cash generated from operations.
In an indirect cash flow statement, you begin the Cash Flow from Operations section with net income from the income statement. Adjust it for changes in working capital balances and (add back) non-cash items like depreciation and amortization. Unlike the cash flow statement to reach the amount of cash flow, EBITDA doesn’t adjust for the changes in working capital balances and, therefore, doesn’t result in the equivalent amount of cash.
Return on Sales vs Return on Equity
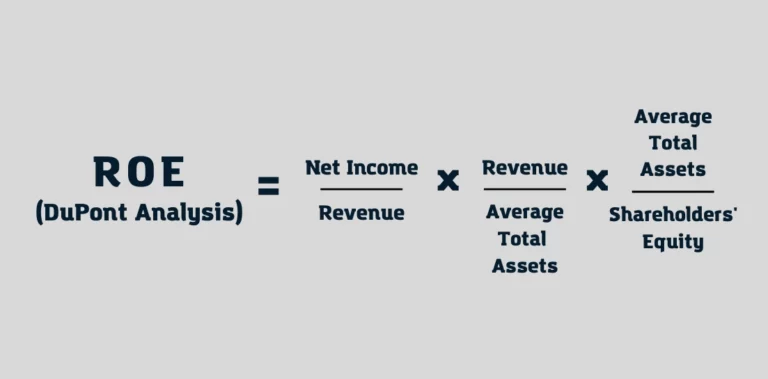
Whereas return on sales (ROS) is measured as EBIT for operating profit divided by net sales or net revenues, return on equity (ROE) is measured in whole as net income divided by average shareholder’s equity. But return on equity can be expanded into the 3-part DuPont formula to gain insights for improving business efficiency and returns.
The 3-step DuPont formula for return on equity is:
The first term of the DuPont formula for return on equity is Net Income divided by Revenue, also called the net profit margin. The second term is Revenue divided by Average Total Assets, also known as asset turnover. The third term of the DuPont analysis is Average Total Assets divided by (average) Shareholders’ Equity, also known as financial leverage or the equity multiplier.
Return on Sales vs Return on Investment
The difference between return on sales and return on investment is that return on sales is the percentage of operating profit (EBIT) from net sales (or net revenues), whereas return on investment measures the increase (or decrease) in the value of an investment over time, generated from investing money.
Return on sales measures the profitability of net revenues, and return on investment measures the profitability of an investment. The investment may either be a stock investment (with market value gains and dividends received) or a business investment in a project that will generate revenues and incur initial costs and ongoing costs, like the launch of a new product.
Return on Sales + Automation
Businesses can improve their return on sales by using AP automation software that includes self-service supplier onboarding. Payables automation and global payments software reduce the time your business spends on end-to-end payables processes by up to 80% by using AI/ML and automated rules for increased efficiency and eliminating paper documents. You may not need as many new hires to handle the workload.
You can speed up the monthly financial close by 25% with payables automation, shifting tasks to higher-level strategic finance. Strategic finance not only improves operational efficiency, but also helps with decision-support to find and justify investing in new revenue streams and ways to reduce costs. Higher revenue or lower operating costs contribute to a higher return on sales.
AP automation software significantly reduces errors and fraud risk. See Tipalti’s Payment Error Cost Calculator to understand how much errors in payments related to accounts payable are costing your business.
Your company can automate its global regulatory compliance and supplier tax compliance with AP automation software when making global supplier payments.
Another way that AP automation software helps your business improve its return on sales is by cutting inventory costs of purchases by processing invoices in time for your business to take its early payment discounts. A 2/10 net 30 early payment discount is a 2% discount for paying an invoice within 10 days instead of 30 days. The annualized return on a 2/10 net 30 discount is 36.7%.
Achieving operational efficiency not only cuts expenses and increases profits. It also improves cash flow.
Conclusion
Return on sales or ROS is an efficiency ratio measuring profitability from continuing operations generated from net sales or net revenues. Automatically compute and graph ROS trends monthly for your business. Compare the metric to ROS in prior years and the prior month or quarter. Benchmark your company’s return on sales with its industry competitors.
Strive to improve your company’s performance, as measured by return on sales. Consider strategic finance techniques to increase revenues and improve operational efficiency. Using AP automation software is a digital transformation strategy to reduce costs, resulting in a higher ROS percentage. To improve return on sales, read our eBook: “The CFO’s Guide to Payables Automation.”
